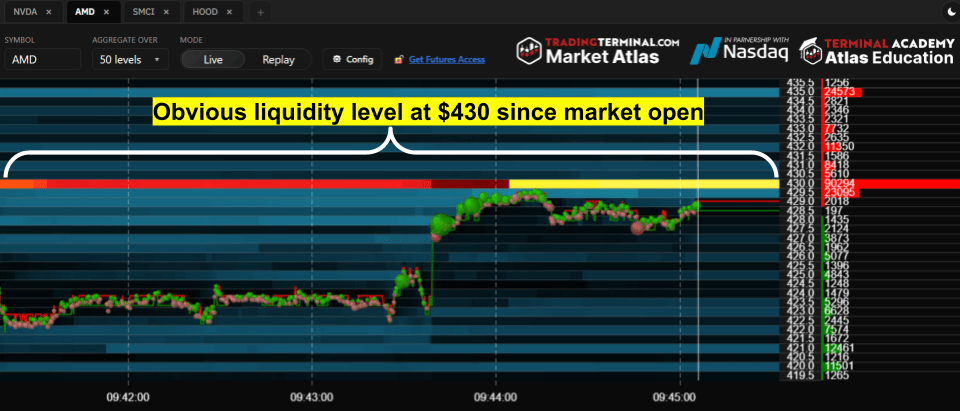
The real edge was not just the chart pattern. The edge came from reading the depth of market and liquidity imbalance using Trading Terminal Market Atlas.
The Secret Behind These Momentum Breakouts
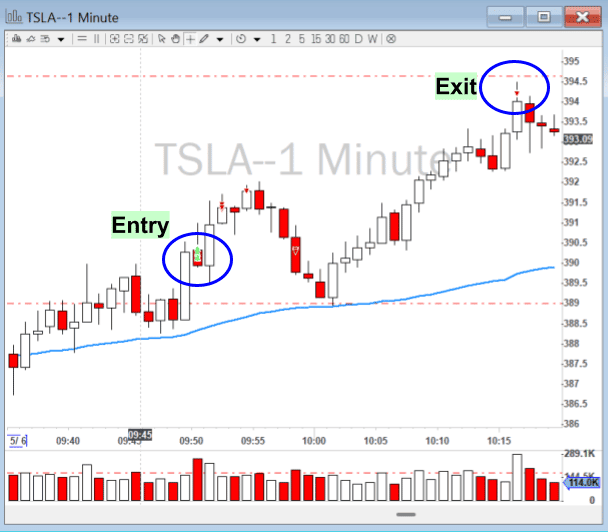
Most traders wait for confirmation after the breakout already happens.
Professional momentum traders try to anticipate the breakout before the crowd reacts.
What we monitor inside Market Atlas is simple:
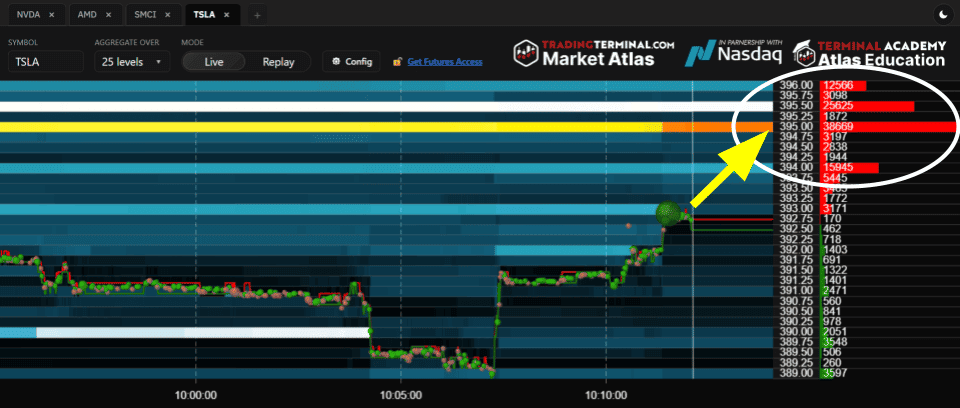
– Where are the large buyers?
– Where is liquidity stacked?
– Are sellers weak or disappearing?
– Is there a major imbalance favoring one direction?
When significant bids appear above the market and there are very few large asks holding price down, momentum can accelerate very quickly.
If the chart pattern is bullish and the liquidity imbalance confirms the move, you can participate early and manage the trade with partials into strength.
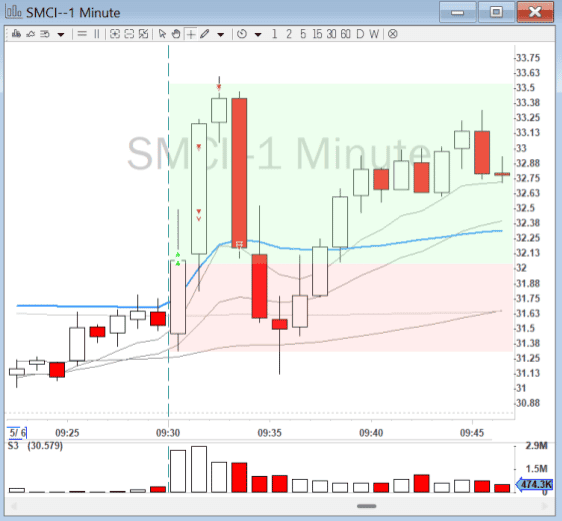
SMCI 1-min Opening Range Breakout
SMCI provided a textbook one-minute Opening Range Breakout setup.
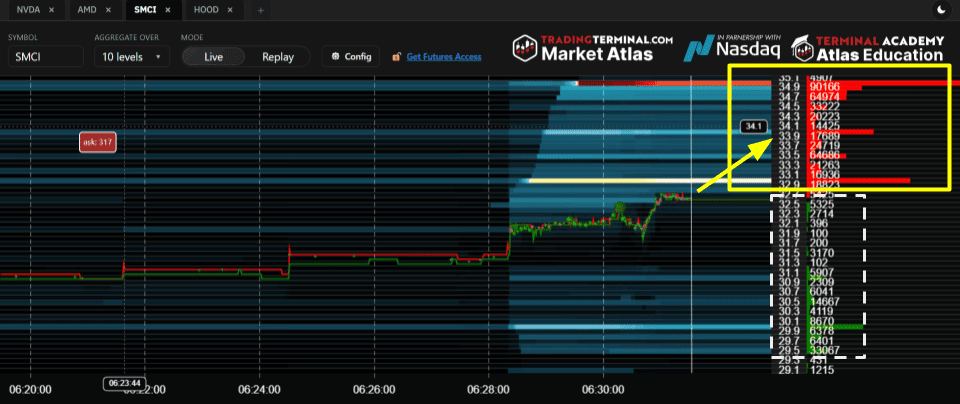
Right after the open, Market Atlas showed aggressive liquidity stacked to the upside while the ask side remained relatively thin.
There were no meaningful sellers absorbing the move.
That imbalance helped identify the potential breakout from $32 to $33.63 before the momentum candle fully expanded.
|