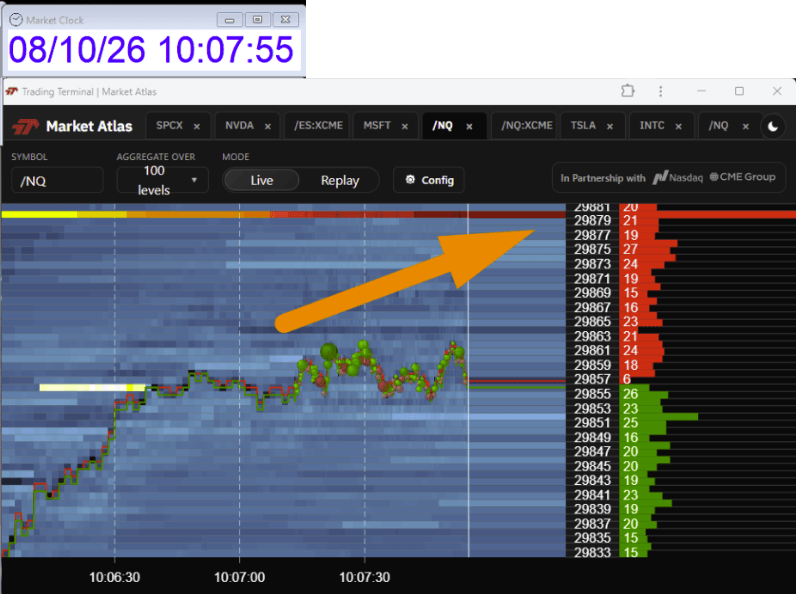
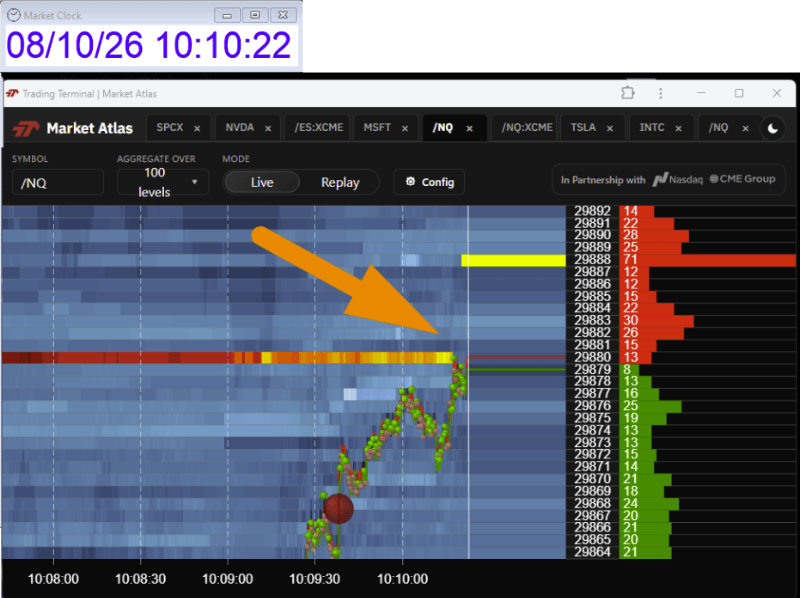
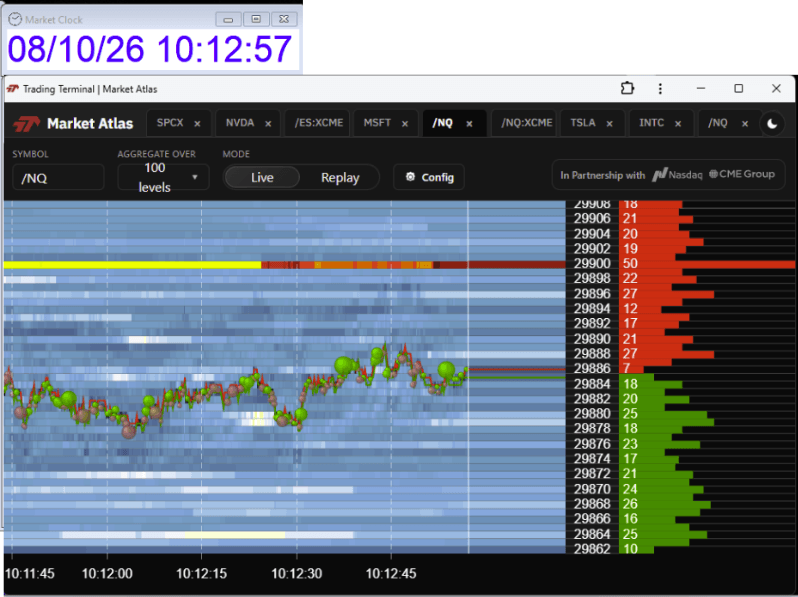
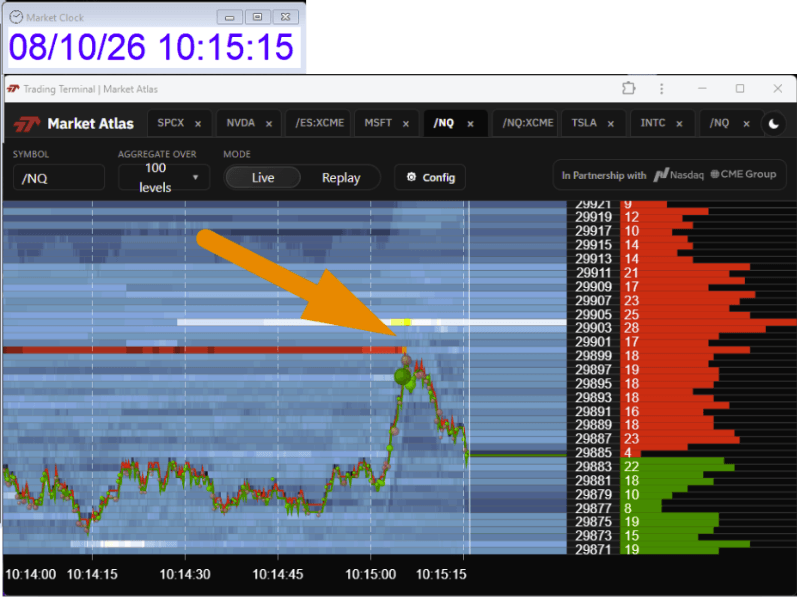
Minutes later, NQ pushed higher into the area we had been watching before reversing back down.
This screenshot might actually be my favorite of the four. Because it illustrates another important part of liquidity trading:
Liquidity isn’t only useful for finding a potential destination. It can also help me think about where a move may encounter a reaction.
Price pushed higher, tested the area, and then pulled back. For a scalper, that information can be incredibly valuable. I’ve been trading for more than 13 years. For a long time, traders had Level 2 and traditional depth-of-market windows filled with rapidly changing numbers. That information is valuable, but interpreting it in real time isn’t always easy.
One of our goals with Trading Terminal Market Atlas has been to make that information much more visual. With access to professional market data, including our work with CME Group, we’ve built Market Atlas to help traders visualize liquidity and depth of market across futures such as ES and NQ.
And you don’t necessarily need to trade the full-size contracts. That’s exactly what I did today. I watched the liquidity on NQ and used MNQ to execute my trades.
For me, that gives the best of both worlds: I can study the liquidity and market structure of NQ while choosing the contract and position sizing appropriate for my own trade.
Market Atlas Doesn’t Predict the Market
This is important. Market Atlas isn’t a crystal ball. A large order appearing at a certain price does not guarantee that the market will trade there. Liquidity can change. Orders can be canceled. Price can reverse long before reaching a level.
What Market Atlas does is take information that can be difficult to interpret in a traditional DOM and make it visual. For me, that helps answer questions such as:
- Where is the liquidity?
- Where could the next important battle happen?
- Where might I take profits?
- Where could a breakout accelerate or fail?
- And how should I manage my risk as price approaches those areas?
Today was a great example. Within approximately seven minutes, we watched two important liquidity areas develop and then watched NQ interact with those areas in real time. And I was able to capitalize on one of those moves with an approximately $7,000 MNQ scalp.
If you’re trading NQ, MNQ, ES, or MES, I think understanding depth of market and liquidity is becoming increasingly important. You don’t have to trade exactly the way I trade. You don’t have to take every move toward a liquidity level.
But I believe you should at least be able to see what is happening underneath the market. That’s what we’re trying to accomplish with Market Atlas.
 Start Your 7-Day Trial to Use Market Atlas on TradingTerminal.com