


Best Heatmap Software Trading Tool in 2026: Market Atlas vs Bookmap, Quantower, Atas and More
Choosing the Right Order Flow & Heatmap Trading Platform in 2026
In 2026, traders have access to more market data than ever. The real challenge is no longer getting the data. It is turning that data into something useful quickly enough to make a trading decision.
Order flow and heatmap platforms such as Market Atlas, Bookmap, ATAS, Quantower, and Sierra Chart all give traders a deeper look inside the market than a traditional candlestick chart. They can reveal resting liquidity, Level 2 market depth, executed volume, bid and ask activity, and potential areas where buyers and sellers are concentrated. But the way each platform presents that information, the amount of setup required, and the tools surrounding it can be very different.
For an active day trader or scalper, choosing a platform is therefore about more than finding the heatmap with the longest feature list. Ease of use, market-data access, order-flow visualization, stock-research tools, pricing, customization, and the overall trading workflow all matter.
This comparison looks at each platform in a real trading environment rather than evaluating heatmaps in isolation. The goal is to understand where each platform excels, what type of trader it is built for, and which tools make it easier to move from seeing market data to actually using it.
What We Compare
- Order-flow and liquidity visualization
- Level 2 and depth-of-market data
- Ease of use and learning curve
- Stock research and trading tools
- Market-data access and setup
- Pricing and additional subscriptions
- Customization and advanced analytics
- Education, community, and trader support
Market Atlas vs. Bookmap: Which Is Better for Active Day Traders?
Bookmap has established itself as one of the most recognizable platforms for visualizing order flow, giving traders a detailed view of liquidity, executed volume, and changes inside the order book. Market Atlas approaches the same problem from a different direction.
Rather than trying to display as much market information as possible, Market Atlas is designed around making the information easier to understand, faster to identify, and more practical for active stock traders to use.
That creates an important distinction between the two platforms. Bookmap offers greater depth and customization for traders who want to dissect the order book in detail. Market Atlas focuses on simplifying that information, surfacing important liquidity levels, and connecting order flow with the rest of a trader’s research workflow.
So the question is not simply which platform has more features? It is which platform gives an active day trader the clearest path from seeing the data to actually using it.
The Most Beginner-Friendly Interface
Order flow is already complex. The software used to read it does not need to make it harder. That is one of the clearest differences between Market Atlas and Bookmap.
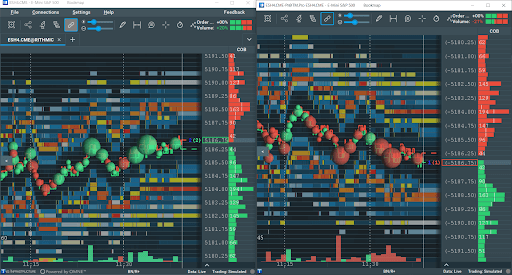
At first glance, the difference is clear. Bookmap presents traders with multiple toolbars, icon-based controls, heatmap layers, volume bubbles, order-flow indicators, a price ladder, histograms, and numerous configurable elements. For an experienced order-flow trader, that level of customization can be valuable. For someone opening an order-flow platform for the first time, however, the learning curve can be overwhelming.
Market Atlas takes a more streamlined approach. Its main controls are clearly labeled Symbol, Aggregate Over, Mode, and Config, while the heatmap remains the dominant element on the screen. Instead of surrounding traders with persistent controls and settings, the interface keeps their attention on what they opened the platform to see in the first place: price, liquidity magnets, executed trades, and unusually large orders.
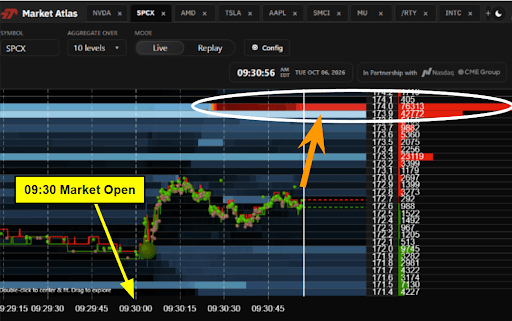
The difference comes down to visual hierarchy. With Market Atlas, a beginner can more quickly understand where to look. Larger liquidity zones stand out from the surrounding order book, the price ladder remains visible, and fewer interface elements compete with the heatmap for attention.
That does not mean Bookmap’s additional complexity is a weakness for everyone. Advanced traders may value its extensive customization and deeper configuration options. But for someone learning Level 2 depth of market and order flow for the first time, Market Atlas provides a simpler starting point without requiring them to first learn an equally complex piece of software.
The goal is simple: spend less time figuring out the platform and more time understanding the market.
One Subscription. Everything You Need
With Market Atlas, the price you see is much closer to the price you actually pay.
Trading Terminal Premium bundles Market Atlas, Nasdaq TotalView, CME Market Depth, real-time charts, market replay, a trading simulator, advanced scanners, fundamentals, earnings data, market heatmaps and live audio news into one subscription. There is no need to build the platform piece by piece just to access the core tools and data.
Bookmap takes a more modular approach. Its software subscription is separate from live U.S. stock and futures market data, and traders can also purchase additional specialized indicators and tools through Bookmap’s marketplace. That flexibility can make sense for experienced traders who want to customize every part of their setup, but it can also mean more subscriptions, more add-ons and a higher total cost.
Market Atlas keeps the structure simple: one subscription gives traders the data, tools and platform they need in one ecosystem.
For someone who wants to spend more time trading and less time figuring out which data feed, package or add-on they still need, that simplicity is a meaningful advantage.
| Feature / Service | Market Atlas / Trading Terminal Premium | Bookmap |
|---|---|---|
| Platform access | ✓ Included | ✓ Included |
| Nasdaq depth data | ✓ Included | Separate data subscription |
| CME market depth | ✓ ES, NQ & RTY included | Separate data subscription |
| Scanner, fundamentals & earnings tools | ✓ Included | Not part of the core Bookmap package |
| Specialized additional tools | ✓ Trading Terminal tools included | Optional paid add-ons available |
| Pricing structure | One subscription | Software + data + optional add-ons |
Identify Key Stock Trading Levels Instantly
For U.S. stock traders, the value of an order-flow platform is not simply how much data it can display. It is how quickly that data can be turned into something actionable.
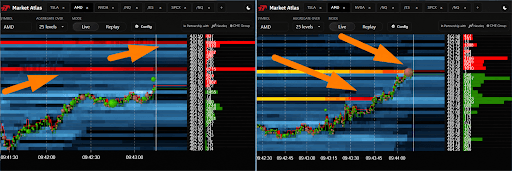
That is where Market Atlas takes a different approach. Its interface is designed to make significant liquidity levels stand out immediately. Large resting orders are visually emphasized as clear liquidity magnets, with prominent orange markers drawing the trader’s attention to the prices that may matter most.
Market Atlas is designed around that idea. Rather than forcing traders to interpret every change in a dense heatmap, it makes unusually large concentrations of liquidity stand out visually. In the AMD example below, the major liquidity magnets are immediately distinguishable from the rest of the order book, with the orange arrows highlighting the areas that deserve the trader’s attention.
Bookmap provides a much deeper and highly customizable visualization of the order book, but its heatmap can present significantly more information at once. For experienced order-flow traders, that additional depth can be valuable. For a stock trader who simply wants to answer “Where is the important liquidity?”, there can be more information to interpret before arriving at the same conclusion.
Market Atlas is built around making that answer obvious. Instead of requiring traders to study every change in heatmap intensity, bubble size, and order-book movement, it brings unusually significant liquidity to the foreground.
For an active U.S. stock trader, that means less time decoding the heatmap and more time understanding the levels that could actually influence the trade.
Bookmap shows you the order book. Market Atlas is designed to show you where to look.
Built by Real, Active Day Traders & Scalpers
Market Atlas was not built in isolation by a software team trying to guess what traders need. It was shaped from the ground up by people who actively trade the markets themselves.
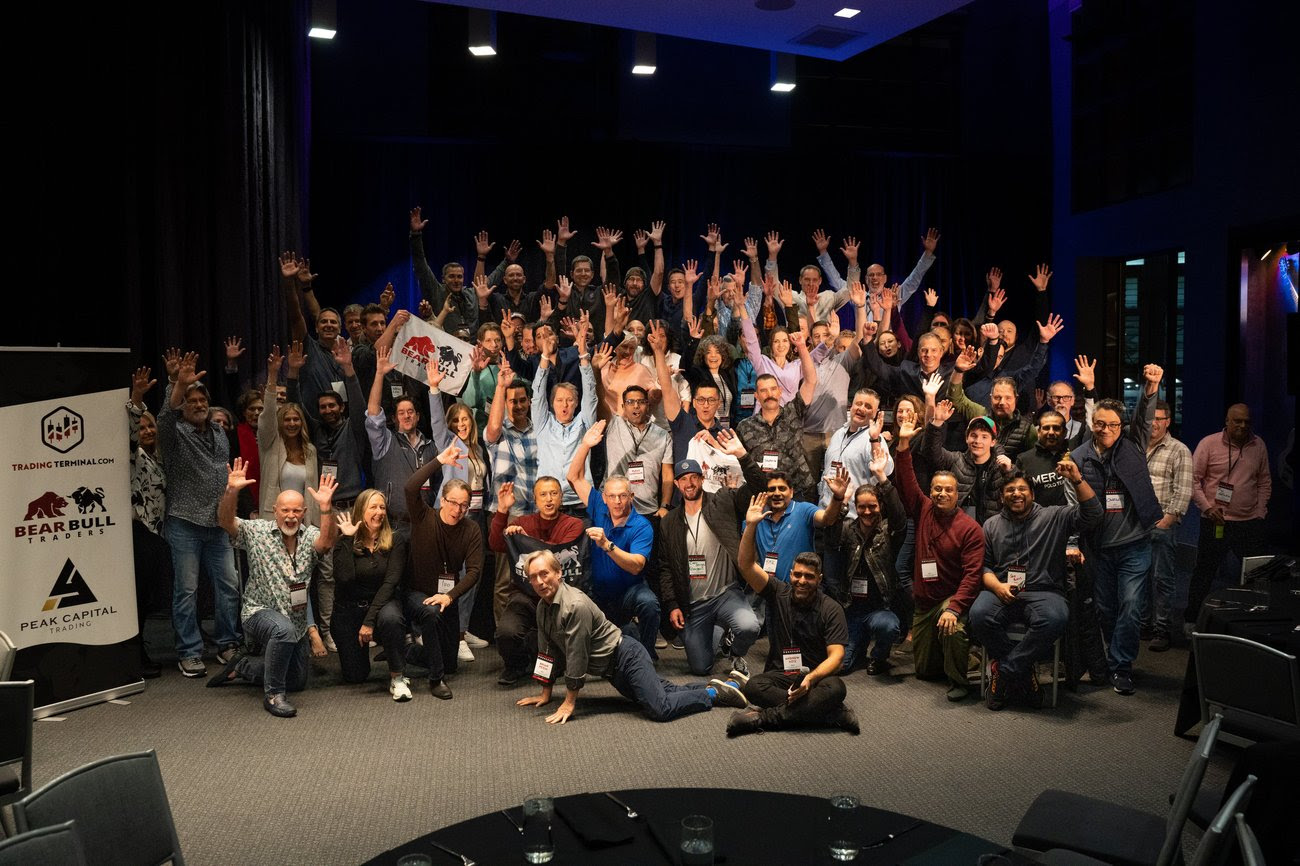
That includes Andrew Aziz, an active day trader, author, and founder of Trading Terminal and Bear Bull Traders, alongside experienced traders and mentors from the broader stock-trading community. Andrew has described Market Atlas as a tool “we built together as a community,” reflecting how closely its development has been connected to traders actually using order flow in live markets.
That creates a different kind of product feedback loop. The people helping shape Market Atlas are also the people using it to identify liquidity, plan trades, manage risk, and teach those same concepts to other traders. Andrew continues to trade with Market Atlas himself and regularly shares real examples of how he incorporates its liquidity signals into his trading decisions.
The same experience extends into the Bear Bull Traders community, where active traders and mentors trade live, review setups, answer questions, and provide real-time feedback. That gives Market Atlas users something beyond the software itself: access to people who understand why the tool was built the way it was and how it is intended to be used in actual market conditions.

Bookmap also offers education and a trading community. The distinction is that Market Atlas is closely tied to an established community of active stock traders whose day-to-day trading experience has helped shape the product itself.
Where Bookmap Still Holds Its Ground
Market Atlas does not need to beat Bookmap at everything to offer a better fit for certain traders. There are areas where Bookmap’s more specialized approach remains a clear strength.
- Advanced order-flow customization. Bookmap gives experienced traders considerably more control over how they visualize and analyze market microstructure. Its platform includes configurable heatmaps, volume dots, DOM tools, proprietary indicators, APIs for custom indicators and even nanosecond-level zoom. For traders who want to customize nearly every element of their order-flow setup, that depth can be valuable.
- Broader multi-asset flexibility. Bookmap is designed to analyze stocks, futures and crypto, with support for multiple exchanges, brokers and data connections. Traders who move between several asset classes may value that broader infrastructure more than a stock-focused workflow.
Bookmap is built for traders who want to go as deep into order flow as possible. Market Atlas is built for traders who want to make order flow easier to understand and easier to use.
For active stock traders who value a simpler interface, clearly highlighted liquidity levels, an all-in-one subscription, and access to a broader stock-research ecosystem, that difference is where Market Atlas stands out.
Market Atlas vs. ATAS: Which Order Flow Platform Is Better for Stock Traders?
ATAS and Market Atlas both give traders a way to visualize order flow, market depth, and liquidity, but they are built around very different experiences.
ATAS is a highly specialized order-flow platform designed for traders who want deep control over footprint charts, volume analysis, DOM tools, delta, and market microstructure. Market Atlas takes a more focused approach: make important liquidity easier to identify, remove unnecessary setup, and give active stock traders a faster path from market data to an actual trading decision.
For traders choosing between Market Atlas and ATAS, the main difference is not simply how much data each platform can display. It is how much work the trader has to do before that data becomes useful.
Market Atlas Opens Directly in Your Browser, No Software to Install
One of the biggest differences between Market Atlas and ATAS is how traders access the platform.
Market Atlas runs directly inside Trading Terminal through the browser. There is no separate desktop platform to install before getting started. A trader can log in, search a ticker, open Market Atlas, and begin analyzing the order book from the same environment they already use for charts, scanners, news, fundamentals, and other research tools.
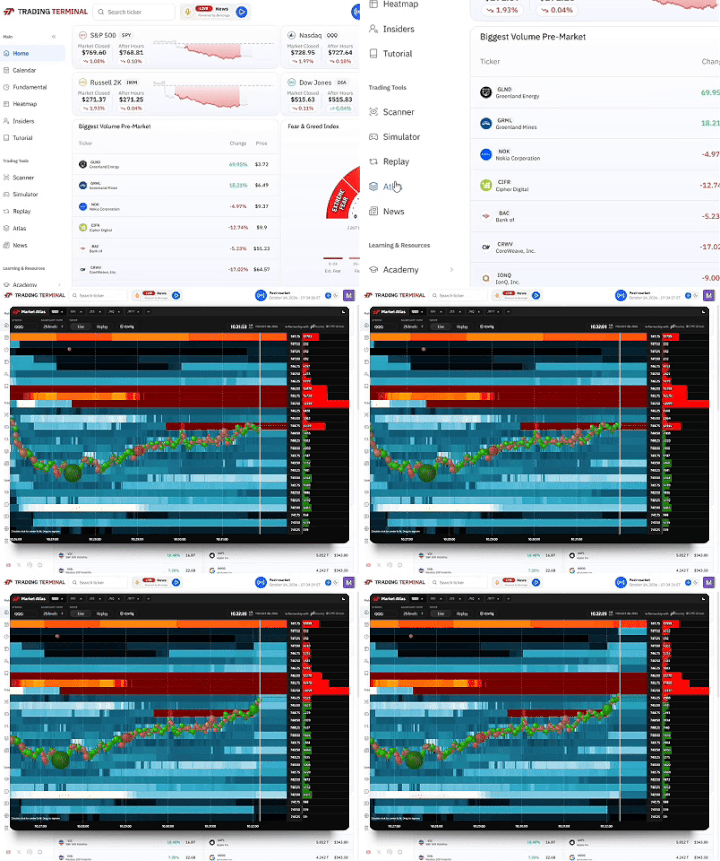
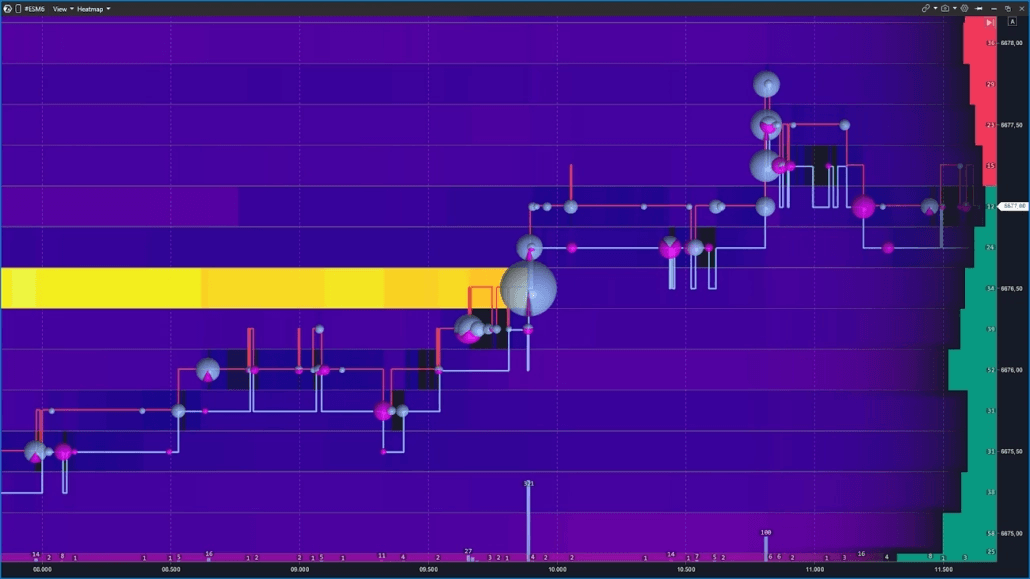
ATAS is built more like a traditional professional trading platform. Its desktop software gives experienced traders extensive control over layouts, connections, indicators, chart types, and order-flow tools, but that flexibility also introduces additional setup.
For traders who enjoy building a highly customized workstation, that can be an advantage. For someone who simply wants to open a stock and understand where the important liquidity is sitting, Market Atlas offers a more direct path.
Market Atlas removes steps between opening the platform and reading the market.
See the Liquidity That Matters First
ATAS is capable of displaying an enormous amount of order-flow information. Traders can work with footprint charts, delta, volume profiles, Smart DOM, Smart Tape, cumulative volume delta, and hundreds of footprint configurations.
That depth is one of ATAS’s biggest strengths. It can also mean that traders have considerably more information to interpret.
Market Atlas is designed around a simpler question:
Where is the important liquidity showing where real orders are waiting to be filled?
Instead of requiring traders to analyze every change in heatmap intensity or build a highly customized order-flow layout, Market Atlas visually emphasizes unusually large concentrations of resting liquidity magnets. Significant bid and ask levels stand out from the surrounding order book, allowing traders to identify potential support, resistance, liquidity walls, and areas of interest much faster.
For an active stock trader watching names such as $AMD, $NVDA, $TSLA, or $AAPL, that speed matters. The goal is not necessarily to analyze every individual order in the market. It is to quickly understand which price levels may deserve attention before entering, managing, or exiting a trade.
ATAS gives traders more ways to dissect the order book. Market Atlas is designed to make the most significant levels obvious to traders using fast-paced day trading strategies.
Market Depth Without Building a Separate Data Setup
Similar to Bookmap, ATAS does not include its own live market data, so traders generally need to connect a compatible broker or external data provider to access real-time quotes and depth-of-market information.
Market Atlas takes a more integrated approach. Trading Terminal Premium includes Nasdaq TotalView and CME Market Depth for ES, NQ, and RTY, alongside the rest of the Trading Terminal ecosystem, reducing the need to manage separate data connections.
| Feature | Market Atlas | ATAS |
|---|---|---|
| Platform access | Browser-based | Desktop software |
| Nasdaq market depth | Included with Trading Terminal Premium | External data connection required |
| CME market depth | ES, NQ & RTY included | External data connection required |
| Stock research tools | Integrated into Trading Terminal | Primarily order-flow focused |
| Setup approach | Log in and start analyzing | Configure platform and data source |
For traders who value simplicity, the advantage is straightforward: Market Atlas combines the software, core market-depth data, and broader stock-trading workflow in one place.
Where ATAS Still Holds Its Ground
ATAS remains a strong platform for traders who want to go much deeper into market microstructure.
- Advanced footprint and volume analysis. ATAS offers extensive footprint charts, delta tools, volume profiles, Smart DOM, Smart Tape, cumulative delta, and highly configurable order-flow analytics.
- Greater customization for specialist order-flow traders. Experienced users can build highly customized layouts, combine numerous indicators, and analyze order flow at a much more granular level.
That makes ATAS especially attractive to traders who want their order-flow platform to function as a specialized analytical workstation.
Market Atlas is aimed at a different type of experience.
ATAS is built for traders who want to dissect order flow in depth. Market Atlas is built for traders who want important liquidity to be easier to find, easier to understand, and easier to use alongside the rest of their stock-trading workflow.
Market Atlas vs. Quantower: A Specialist Tool vs. a Full Trading Terminal
Quantower and Market Atlas solve different problems.
Quantower is designed to function as a complete trading workstation. It supports more than 40 trading and analytical panels, connections to over 60 brokers, exchanges and data providers, direct order execution, portfolio management, options tools, automation, and multiple asset classes.
Market Atlas is much more specialized. It is not trying to replace every platform on a trader’s desk. Its purpose is to give active traders an additional layer of information that traditional candlestick charts cannot show: where meaningful pending liquidity is sitting in the order book.
That distinction creates a very different experience.
A Second Screen, Not a New Trading Operating System
Quantower is built for traders who want to construct their entire trading environment inside one platform.
Charts can be grouped into workspaces, multiple broker and data connections can run simultaneously, orders can be submitted directly from charts or the DOM, and advanced users can build indicators and automated strategies through Quantower’s API.
Market Atlas does not require traders to reorganize their trading setup around it.
Trading Terminal itself recommends using Market Atlas side-by-side with a candlestick chart. A trader can continue using the broker and execution platform they already know while using Market Atlas as an additional source of order-book liquidity intelligence.
That can be particularly useful for discretionary day traders. They do not necessarily need another platform controlling their charts, orders, accounts, portfolios, and execution. They may simply want another piece of information before making the trade.
Market Atlas is designed to complement your trading desk, not take it over.
Built for the Decision Before the Click
Quantower’s strength becomes most obvious once a trader is ready to execute. Its DOM Surface supports one-click order submission, order modification, detailed trade inspection, imbalance statistics, and direct interaction with the market from inside the order-flow display.
Market Atlas focuses more heavily on the decision that comes before that execution.
A trader may already have a setup forming on a candlestick chart. The remaining questions are often:
- Is there meaningful liquidity above or below price?
- Where are other market participants waiting?
- Does the Level 2 order book support the trade idea I am already considering?
Market Atlas is built to provide that additional context. Instead of becoming the place where every part of the trade must happen, it can function as a confirmation layer for conviction between spotting the setup and pressing the buy or sell button.
That makes its role particularly clear for scalpers and active day traders: the chart shows the setup; Market Atlas adds visibility into the orders behind it.
Less Platform Engineering, More Market Context
Quantower’s flexibility is impressive, but much of its value comes from how much traders can build and configure.
Users can connect multiple brokers and feeds, create synthetic instruments, organize custom panels, build templates, use advanced volume-analysis packages, run algorithms, and develop their own tools through C#.
Market Atlas deliberately asks less of the trader.
There is no need to design an entire order-flow workspace before the tool becomes useful. The product already has a defined purpose: combine Nasdaq order-book data with a visual representation of where pending orders and significant liquidity are developing.
For traders who enjoy configuring every component of their workstation, Quantower gives them substantially more freedom.
For traders who would rather use the information than build the environment displaying it, Market Atlas takes the more focused approach.
Where Quantower Holds Its Ground
Quantower clearly has the advantage for traders who want direct multi-broker execution, multi-asset trading, algorithmic strategies, extensive platform customization, or one terminal controlling most of their trading infrastructure. Its support for stocks, futures, options and crypto, along with 60+ connections, is a major part of its appeal.
But that is also what separates the two products.
Quantower is built to be the trading workstation. Market Atlas is built to give the trader another piece of information before making the trade.
Which Heatmap Trading Platform Is Right for You?
There is no single order-flow platform that is best for every trader. Bookmap, ATAS, Quantower, and Market Atlas are built around different priorities.
Bookmap makes sense for traders who want extremely deep order-flow visualization and extensive customization.
ATAS stands out for footprint charts, volume analysis, DOM tools, and traders who want to study market microstructure in detail.
Quantower is better suited to traders looking for a highly customizable, multi-asset trading workstation with broker connectivity and execution tools.
Market Atlas takes a different approach. It is built for active stock traders who want to identify meaningful liquidity quickly without turning order-flow analysis into another platform they have to master.
| Feature / Aspect | Market Atlas | Bookmap | ATAS | Quantower |
|---|---|---|---|---|
| Beginner-friendly order flow | Strong | Moderate | Moderate | Moderate |
| U.S. stock liquidity | Strong | Strong | Supported | Supported |
| Footprint / volume analysis | Focused | Strong | Very Strong | Strong |
| Advanced customization | Moderate | Very Strong | Very Strong | Very Strong |
| Broader stock research tools | Included in Trading Terminal | Limited | Limited | Trading-focused |
| Multi-asset workstation | Focused | Strong | Strong | Very Strong |
| Market data bundled | Nasdaq + select CME depth included | Separate depending on setup | External connection | External connection |
| Active trader community | Bear Bull Traders ecosystem | Available | Available | Available |
Why Market Atlas Stands Out
Market Atlas is not trying to become the most complicated order-flow platform on the market.
That is exactly the point.
Its advantage comes from taking information that traditionally requires a specialized order-flow setup and making it easier for active traders to understand and use. Significant liquidity is brought to the foreground, Nasdaq TotalView is integrated directly into the platform, and Market Atlas sits alongside scanners, charts, fundamentals, earnings data, replay, simulation, and breaking news inside Trading Terminal.
For traders who want hundreds of footprint configurations or complete control over every component of their order-flow workstation, platforms such as ATAS, Bookmap, and Quantower may offer greater depth.
But for traders who primarily want to answer questions like “Where is the liquidity?”, “Where could price react?”, and “What levels should I be watching?”, Market Atlas is designed to make those answers easier to find.
The best trading platform is not necessarily the one that displays the most data. It is the one that helps you understand the data fast enough to actually use it.
What Traders Are Saying About Market Atlas
The differences between trading platforms can look small on a feature table. In practice, what matters is whether traders can actually understand the information and incorporate it into their workflow.
That is where feedback from Market Atlas users has been particularly consistent: simplicity, accessibility, and having more of the trading workflow in one place.
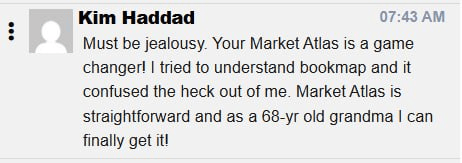
This is exactly what Market Atlas was designed to solve. Order flow does not need to become another complicated system traders have to master. They can immediately start benefiting from it.
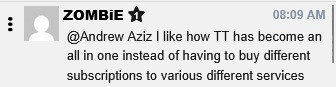
The value is not limited to the heatmap itself. Market Atlas sits inside Trading Terminal alongside scanners, replay, charts, market data, fundamentals, news, and other tools used throughout the trading process.
Some users have even compared the experience directly with competing platforms:

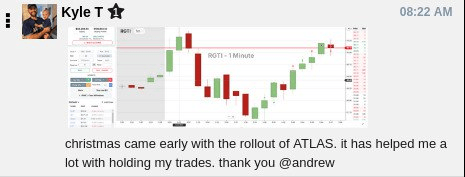
And for traders already using Market Atlas in live markets, the feedback goes beyond the ease of use.
The Bottom Line
Bookmap, ATAS, and Quantower are all capable trading platforms, and each has areas where it excels.
Bookmap offers deep order-flow visualization and customization. ATAS provides sophisticated footprint and volume-analysis tools. Quantower offers an expansive multi-asset trading workstation with extensive connectivity and execution capabilities.
Market Atlas is built around a different idea: make professional order-flow information easier for active traders to actually use.
It combines Nasdaq TotalView and market-depth visualization with an interface built to surface significant liquidity quickly, while sitting inside a wider ecosystem of scanners, charts, fundamentals, earnings data, replay, simulation, and breaking market news.
For traders who want to spend less time configuring their order-flow software and more time understanding what is happening in the market, Market Atlas offers a simpler path.
See Market Atlas in Action
The easiest way to understand the difference is to see the order book yourself.
