


How I Use Depth of Market to Find NQ Scalps
Dear Traders,
I wanted to write a newsletter to share a great example of why liquidity and depth of market have become such an important part of my trading.
On Monday morning, I was trading Nasdaq futures, using MNQ for the execution, while watching liquidity on NQ through Market Atlas. Within just a few minutes, Market Atlas highlighted two important liquidity areas. The first gave me a scalp that generated approximately $7,000 in profit. Then, only a few minutes later, another major liquidity level appeared around 29,900.
The First Liquidity Area: A $7,000 MNQ Scalp
Let me show you exactly what I was seeing. At 10:07:55 AM, NQ was trading around 29,857. But look above the current price.
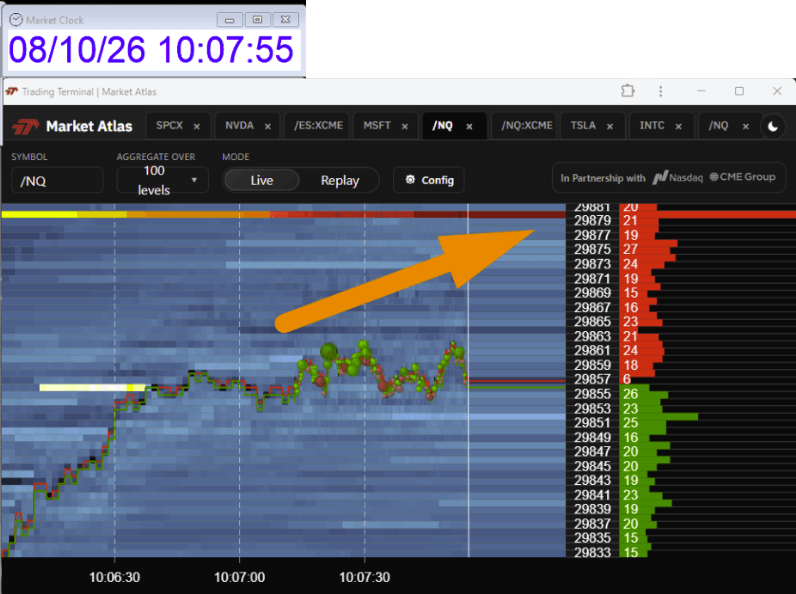
This is where Market Atlas can become extremely useful for my trading. Instead of looking only at candles, I can visualize the depth of market and see where significant liquidity is sitting. When I see something like this, it doesn’t mean the price has to go there. Large orders can move, disappear, or change. There are no guarantees. But now I have information that I can incorporate into my trading plan.
And watch what happened next. Just a few minutes later, at 10:10:22 AM, look where NQ was trading.
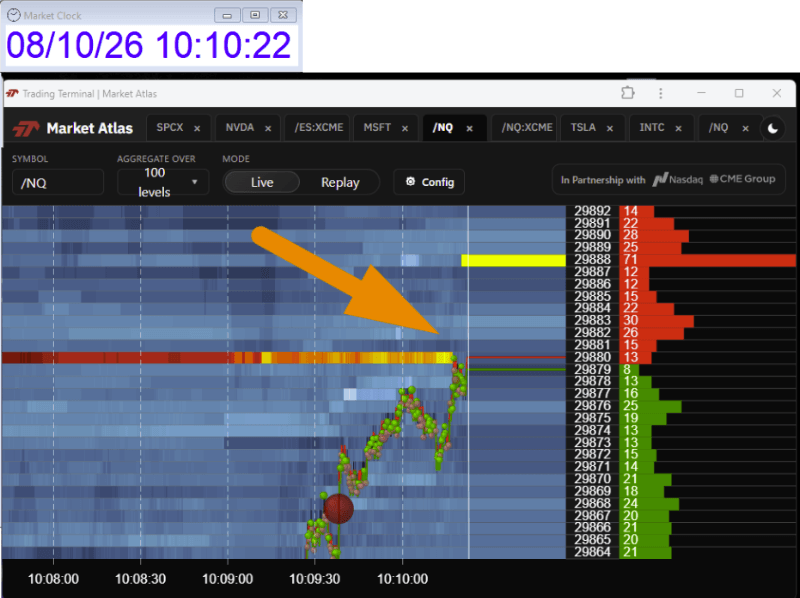
This was a beautiful move. I used MNQ to scalp the move, and this trade generated approximately $7,000 in profit for me. This is exactly the type of trade where I find Market Atlas valuable. I wasn’t simply looking at a chart and saying, “Maybe NQ goes higher.” I had another layer of market information in front of me. I could see the liquidity. I could see the price moving toward it. And I could make my own trading decision based on the price action, liquidity, and risk/reward in front of me.
The Second Liquidity Area at 29,900
But then something else happened. At 10:12:57 AM, Market Atlas was showing another major area above the market. This time, look at 29,900.
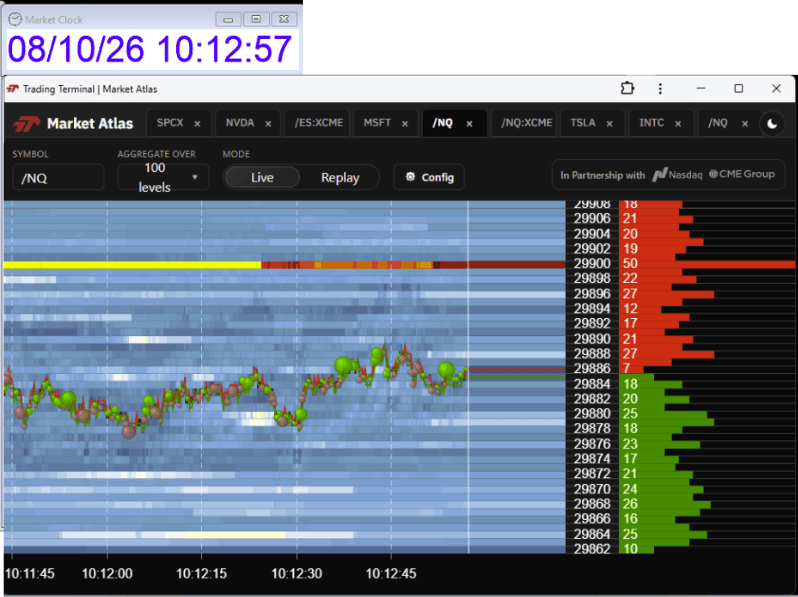
Again, I wasn’t predicting that NQ was definitely going to 29,900. That’s not how I use this tool. I use liquidity as a roadmap. Where could price become attracted? Where could price encounter significant orders? Where might I want to take profit? Where might I expect a reaction? Those are much more useful questions for me than trying to predict exactly what the next candle will do.
And just a couple of minutes later, we got our answer. Now look at the final screenshot.
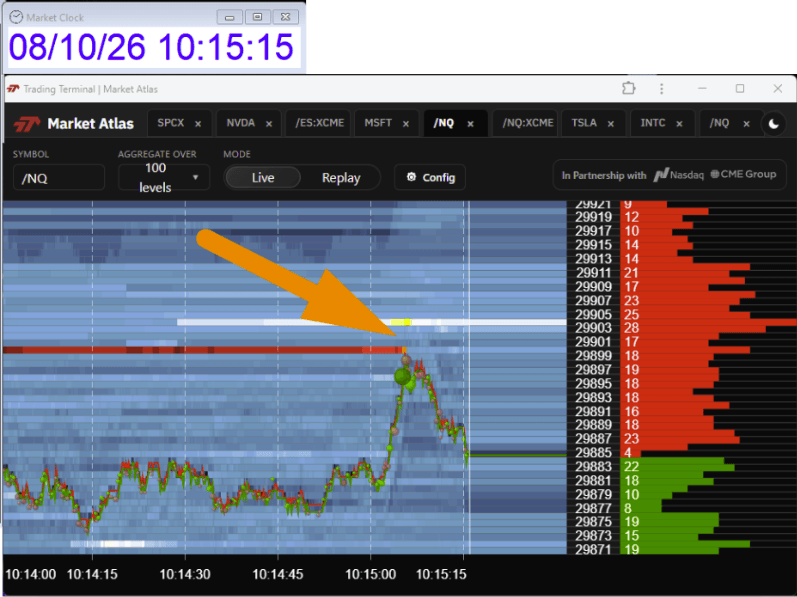
This screenshot might actually be my favorite of the four. Because it illustrates another important part of liquidity trading: Liquidity isn’t only useful for finding a potential destination. It can also help me think about where a move may encounter a reaction. Price pushed higher, tested the area, and then pulled back. For a scalper, that information can be incredibly valuable.
I’ve been trading for more than 13 years. For a long time, traders had Level 2 and traditional depth-of-market windows filled with rapidly changing numbers. That information is valuable, but interpreting it in real time isn’t always easy. One of our goals with Trading Terminal Market Atlas has been to make that information much more visual. With access to professional market data, including our work with CME Group, we’ve built Market Atlas to help traders visualize liquidity and depth of market across futures such as ES and NQ.
And you don’t necessarily need to trade the full-size contracts. That’s exactly what I did on Monday. I watched the liquidity on NQ and used MNQ to execute my trades. For me, that gives the best of both worlds: I can study the liquidity and market structure of NQ while choosing the contract and position sizing appropriate for my own trade.
Market Atlas Doesn’t Predict the Market
This is important. Market Atlas isn’t a crystal ball. A large order appearing at a certain price does not guarantee that the market will trade there. Liquidity can change. Orders can be canceled. Price can reverse long before reaching a level.
What Market Atlas does is take information that can be difficult to interpret in a traditional DOM and make it visual. For me, that helps answer questions such as:
- Where is the liquidity?
- Where could the next important battle happen?
- Where might I take profits?
- Where could a breakout accelerate or fail?
- And how should I manage my risk as price approaches those areas?
Monday was a great example. Within approximately seven minutes, we watched two important liquidity areas develop and then watched NQ interact with those areas in real time. And I was able to capitalize on one of those moves with an approximately $7,000 MNQ scalp.
If you’re trading NQ, MNQ, ES, or MES, I think understanding depth of market and liquidity is becoming increasingly important. You don’t have to trade exactly the way I trade. You don’t have to take every move toward a liquidity level. But I believe you should at least be able to see what is happening underneath the market. That’s what we’re trying to accomplish with Market Atlas.
Start Your 7-Day Trial to Use Market Atlas on TradingTerminal.com →
Learn Futures Trading With Mike
Bear Bull Traders community members also get to learn and execute Futures Trading under real-time market conditions. Mike is the Chief Learning Officer of Peak Capital Trading, and he has been live streaming his futures trading inside the Bear Bull Traders chatroom and the trading bootcamps. Mike also hosted a live webinar teaching the most practical trading skills, where attendees got to ask questions directly. No fluff, only real gems including position sizing, contract selection, capital protection and all other crucial trading skills that you can learn from an experienced trader.
Join Bear Bull Traders and Attend Exclusive Live Mentorships →
For BBT members, don’t forget to study from Mike’s futures trading course available in the Education Center. It is a detailed guide for traders who are new to futures, including proprietary strategy specifically designed for futures contracts such as NQ and ES.
And if you want to see how I personally use Market Atlas, join us in the BBT chatroom. We trade live every morning, and you can watch how I identify these levels and manage my trades while the market is actually moving, not after the fact.
See you in the markets,
Andrew Aziz
